Jan 5 2012
The Red Heather Trail provides an excellent steady climb with no excessively steep sections. It is possible to get in a good warmup and a full interval session and then cap off the day with a few quick laps on Paul’s Ridge before heading home. All within a reasonable drive from Squamish.
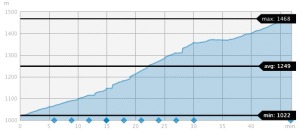
This graph shows the elevation profile of the Red Heather Trail. For this workout, after a easy warmup, I completed eight three-minute intervals of gradually increasing intensity.
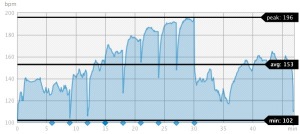
This graph shows heart rate during each interval. While trying to keep my heart rate steady within a range during each interval, it increased by 10 bpm for each one. Unfortunately, I was taking my own lactate measurements so a 60 – 90 sec break between each interval allowed my HR to drop quite low.
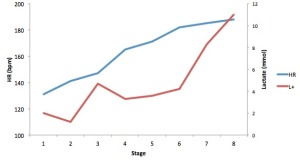
The final graph shows average heart rate for each interval and lactate measurements taken at the end of each interval. With HR as my intensity gauge, I can note where lactic acid begins to accumulate beyond the point where my body can efficiently clear it. The sharp change in slope of the red line shows this point and indicates the effort of exercise which is unstustainable for long periods of time. Training should push this curve to the right, allowing me to work at a high intensity while accumulating less lactate.


